
Data analytics is the process of examining structured and unstructured data sets in order to provide real-time up to update information that can facilitate the company to maximize the decision value in the business.
Inventory optimization is having the right inventory, in the right quantities and at the right locations to meet the supply and demand of parts and materials in the company. That is finding the right balance between inventory and service level.
Data analytics for optimizing inventory will improve the accuracy of inventory orders that is to prevent product shortage and just have enough inventory in the warehouse which will lead to a more organised warehouse that will speed up order fulfilment –ability to get the right stock in the right place at the right time to meet customer’s demand. It also increases efficiency and productivity which eliminate manual processes so that the employees can focus and create values on other more important areas of the business.
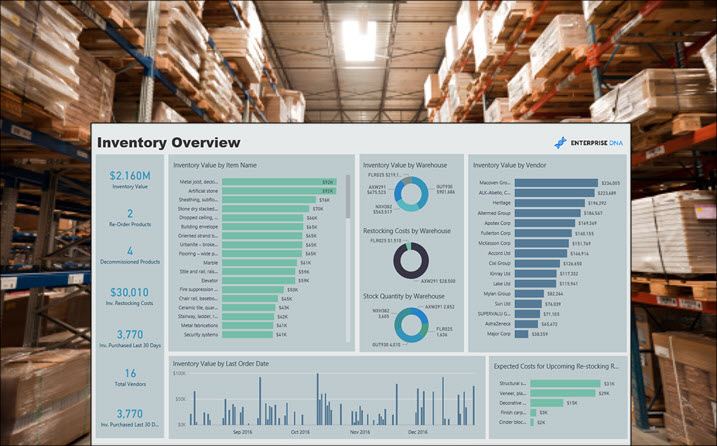
Table of Contents
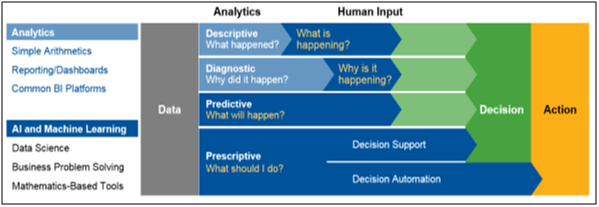
Types of Data Analytics
Descriptive Analytics (What’s happening in the business?)
It uses data aggregation and data mining to provide insight into the past and answer: “what has happened?” It is comprehensive, accurate, live data and effective visualization. Common examples are company reports that simply provide a historic review of a company’s operations, sales, financials, inventory, customers, and stakeholders.
Diagnostic Analytics (Why did it happen?)
It is characterized by techniques such as drill-down, data discovery, data mining and correlations to dive deeper at the data to understand the root causes of events and behaviors; ability to isolate all confounding information. An example is how a company can drill the inventory down to aging days categories to find out why these aging inventories are not delivered to customers.
Predictive Analytics (What will happen?)
It uses the findings of descriptive and diagnostic analytics combine with statistical models and forecasting techniques to provide the company with actionable insights based on data as well as to predict future trends. An example is the demand forecasting trend. It is essential to note that forecasting is just an estimate and its accuracy depend highly on the data quality and stability of the situation. Thus the company has to set an acceptable accuracy tolerance.
Prescriptive Analytics (What’ should we do?)
It uses optimization (example business rules) and simulation algorithms to advise what action to take to eliminate a future problem or take full advantage of a promising trend. An example is optimized production scheduling and inventory in the supply chain to make sure the company can deliver the right products at the right time and optimizing the customer experience.
In a nutshell, descriptive and diagnostic analytics offer a reactive approach whereas predictive and prescriptive analytics make users proactive. Current trends show more companies come to the situation when they need advanced data analysis and choose to adopt it. The term advanced analytics was the umbrella term for predictive and prescriptive analytics types.
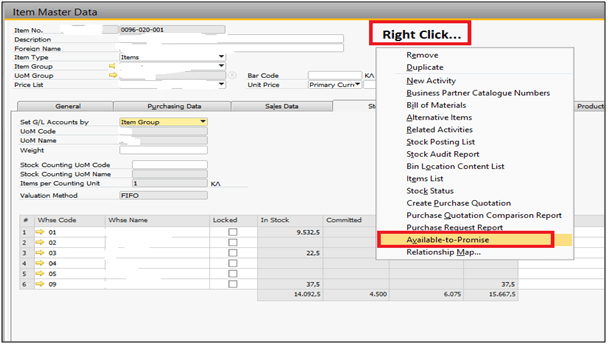
Item Master Data Enhancement
The item master is the company’s DNA and is a record that typically housed within company Enterprise resource planning (ERP) system. The item master should be set up when a new product is introduced into the company. The ERP will have standard fields to populate for the item master, but there will also be custom fields that can use to tailor the item master to the company’s specific needs.
The item master should contain, at a minimum, the following information:
• Item Name; Item Description; Bill of Materials (BOM); Cost of Goods (COGS); Manufacturing Routers; Manufacturing and Supply Lead Times; Safety Stock Levels; Minimum Order Quantities (MOQ); Order Multiples.
• Enhancement includes defining an item with ABC/XYZ analysis.
The item master should be carefully built and maintained by the centralized data master team who must ensure that every detail within the company’s item master is accurate as from the item master, the ERP will take information to generate data for analysis.
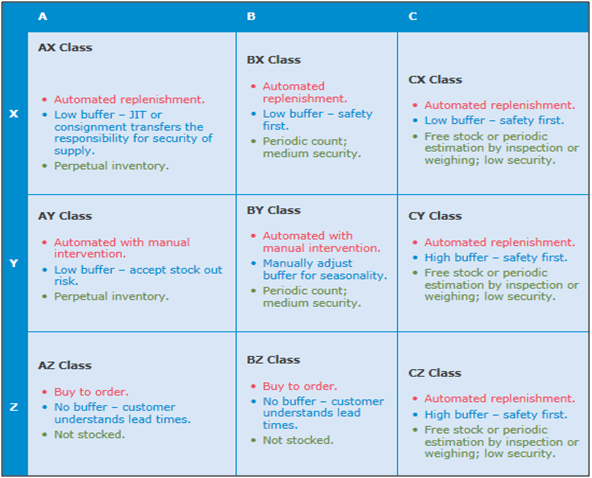
Categorizing Inventory
ABC/XYZ analysis is based on the Pareto principle (often refer to as the 80/20 rule – classical example is that 80% of the sales revenue contribute by 20% of the customers) It is a method of grouping planning item (characteristic value combinations, SKUs) based on their value (revenue or sales volume) and dynamics of consumption or sales. During analysis, items are assigned one of the classes of ABC and XYZ simultaneously. Hence stock management policies, systems, and procedures can be better tailored by taking into account both demand volatility and consumption value. This approach optimizes tensions between costs, risks, and benefits of stock holding.
Policies may include the degree of automation of replenishment processes, buffer stocks, and inventory control. The diagram below illustrates an example.
Automating Demand Forecast
The company’s performance is often dependent on external conditions such as seasonality, market trends, macroeconomic climate conditions and other business trends that can cause unpredictable demand variability (E.g. China –United States trade disputes). By harnessing and applying advance analytics that factor in such external conditions estimates, as well as assigning weight to customer firm orders, customer or sales forecast (also taking account of the past forecast accuracy trend) and historical sales; automation system dynamically calculates to provide a statistical forecast for an item to ensure minimum and maximum order quantities are optimal.
Create a repeatable monthly process for customer or sales forecast accuracy to be measured for continuous improvement and accountability. Accuracy tolerance is dependent on the company’s appetite. A further benefit is that the information input into demand forecasting software is able to be continually updated to ensure that the more accurate forecasts are changing to reflect the changing needs of customers.
Replenishment Automation
Parameters are core settings in the system, use for executing replenishment calculations. These parameters may include demand patterns, inventory classification, inventory turnover ratio, reorder point that take in account the lead time of item. Parameters are dynamic settings that must be updated frequently (usually monthly) in order to prevent stock out (might cause lost sales), excess stock (might turn into obsolete which should be liquidated to eliminate unnecessary carry costs).
Inventory turnover should be closely watched for every item as over the course of the product’s life cycle, demand will fluctuate and cause variability in the supply chain. Tracking demand patterns are one way to ensure product replenishment calculations are accurate and optimized. In cases where the reliability of supply is not very high, it would be good to add some quantities on top of the optimal inventory level in order to cover supply failures and provide higher service level.
The full content is only visible to SIPMM members
Already a member? Please Login to continue reading.
References
Alex Bekker. (2019). “4 types of data analytics to improve decision-making”. Retrieved from https://www.scnsoft.com/blog/4-types-of-data-analytics, accessed 20/06/2019.
CGMA. (2019). “ABC-XYZ inventory management”. Retrieved from https://www.cgma.org/resources/tools/cost-transformation-model/abc-xyz-inventory-management.html, accessed 22/06/2019.
Daniel Fritsch. (2015). “6 Inventory Control techniques for stock optimization”. Retrieved from https://www.eazystock.com/blog/2015/08/03/6-inventory-control-techniques-for-stock-optimization/, accessed 21/06/2019.
Gary Marion. (2019). “The item master is Your Company’s DNA.” Retrieved from https://www.thebalancesmb.com/item-master-company-management-4153514, accessed 21/06/2019.
Ruth Ng, ADPSM. (2019). “Data Analytics and Artificial Intelligence for Cognitive Procurement”. Retrieved from SIPMM: https://publication.sipmm.edu.sg/data-analytics-artificial-intelligence-cognitive-procurement/, accessed 20/06/2019.
Terese Ong, DLSM. (2018). “Five important techniques for effective inventory control”. Retrieved from SIPMM: https://publication.sipmm.edu.sg/five-important-techniques-for-effective-inventory-control/, accessed 20/06/2019.
Thomas Maydon. (2017). “The 4 types of Data Analytics”. Retrieved from https://insights.principa.co.za/4-types-of-data-analytics-descriptive-diagnostic-predictive-prescriptive, accessed 20/06/2019.
Thorsten Ohm. (2017). “How to build a KPI dashboard for inventory management”. Retrieved from https://www.tradegecko.com/blog/inventory-management/how-to-build-a-kpi-dashboard-for-inventory-management, accessed 22/06/2019.