
Over the last 50 years, ship management procurement landscape has changed dramatically. From the early days of faxing over requisitions and waiting for quotations from suppliers based worldwide. Then the game-changer internet and world wide web came. With this connecting between parties became simpler and easier. With available technology today ship management procurement is able to take another leap.
Table of Contents
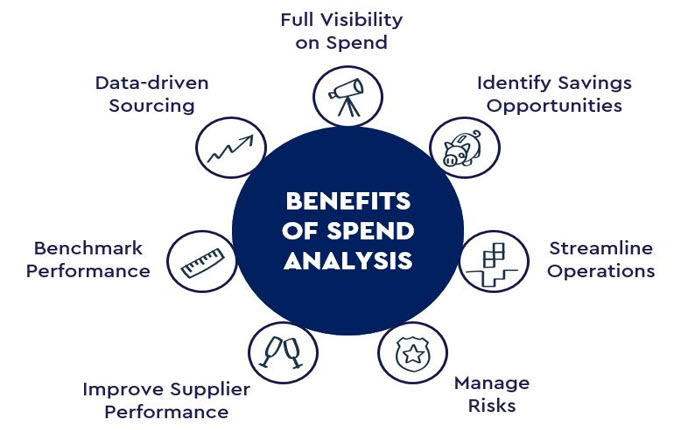
Spend Analysis
It is the act of reviewing spend data to reduce costs, increase efficiency and to improve supplier relationship. Spend analytics is one of the critical tools that procurement organizations use to continuously identify cost saving opportunities, manage risks and improve purchasing power. Data gained from spend analysis can improve perceivability into what the organization spends, further correct any contract compliance issues. In particular organizations have cost savings and improve their bottom line. Additionally, it also aids organizations to strategize short and long term cost savings.
The most common sources of procurement spend analysis data consists of common general ledger information, purchase orders, data shared by suppliers, enterprise resource planning (ERP) which assists with designing, planning and forecasting and lastly other internal systems.

The key benefit spend analysis can provide an organization is increased visibility and significant spend insight. Spend analysis offers an organization greater insight into the amount of money it is spends on purchasing products and services. It enables the organization to view where majority of their expenses are going to. Spend analysis provides a more profound understanding and insight that can be utilized to create initiatives and make confident spending decisions.
Supply Chain Analytics
Assists an organization make, smarter, quicker and a more informed efficient decision. Organizations using analytics gain a significant return on the initial investment made. Supply chain analytics help to identify known risks and predict future risks by spotting patterns and trends. By analyzing data an organization can predict future demand and which items procurement can reduce without negatively impacting operations. This aids in increasing the accuracy of planning for future supply. Supply chain analytics are helping organizations plan for the future by analyzing both structured and unstructured data. This in returns gives organizations an edge allowing them to make an optimal decision.
Data Analytics
It is the process of examining relevant, trusted data to draw conclusions. Data analytical technology is now widely being used in the marine industry to enable the organization to make well informed decisions. Ships generate massive amount data from consumption of stores to spares usage and much more. Analytics assists in making sense all the data uncovering patters and providing insights. Supply chain analytics is also the anchor for applying cognitive technologies such as artificial intelligence (AI) to the supply chain process.
Study conducted by IDC on the digital universe has shown only 3 percent of today’s data is tagged. The definition of tagged data refers to recognized and stored data and of it only 0.5 percent of it is analyzed and useable. The solution to understand what all this unanalyzed data has in it is by using big data analytics.
Volume is only one facet of big data. We must also take into account the speed of expansion of the digital universe. To illustrate 600 items are sold every second on Amazon’s Prime Day, this shows how fast the data is being generated. It is also not only about volume and speed but also the variety of data being generated. Taking a typical ship purchases as an example, in stores they are segregated from deck, engine, cabin, galley and other stores. Every item being sold as a number of data points at work. Transactional data from point of purchase, shipping, delivering, consumer (ship crew) insight data. All of which can actually suggest other items the ship might be interested in.
Structured and Unstructured Data
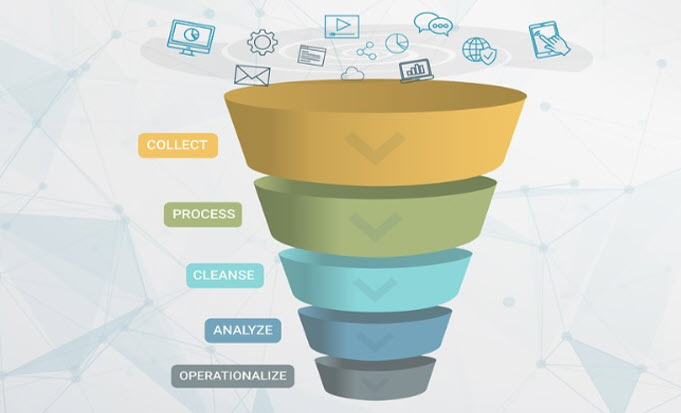
Prior to data being analyzed it first has to be collected. Based on what the data is going to be used for the process of collection varies from one organization to another. Structured data is linear and stores in relational databases. This happens to be the easiest big data programs to dissect. However, this accounts for a very small percentage of today’s data. Unstructured data forms a large portion 80% of today’s data. Examples of unstructured data would be email messages, word processing documents, videos, photos, presentations, webpages and any kind of business documents. Due to the diversity of unstructured data and the randomness big data programs find it more difficult making sense of it.
Batch Processing
Upon data collection and storage, the data must undergo the process of being sorted through for usage. Batch processing dives into massive datasets that have been stored over a period of time. This process is least effective method for processing big data. Although millions of data blocks can be processed in batches the time taken to finish processing could be few hours if not days to see the results.
Stream Processing
A quicker approach which is less time-consuming method for processing big data would be stream processing. When real time analytics is critical to an organization’s success than stream processing will be the best option. Compared to batch processing there is little to no delay from the time data is received and then processed. This allows organizations to make brisk changes if necessary. Stream processing is a useful tool for detecting fraudulent activities with transactional data.
Cleansing Data
Not all data collected is good quality or significant to an organization’s profitability. To remedy data cleaning is required. It is the practice of cleaning or scrubbing through processed data. Data cleansing ensures all data used for analytics is on a standardized format. Data needs to be properly migrated from old technologies and systems that are no longer used within the organization. Duplicated data and non-relevant data also get purged during this process.
Four Types of Data Analytics
With the data collected, stored and processed and scrubbed for quality. It is finally ready to be analyzed. In this step, valuable information is extracted from massive volumes and varieties of data. However not all analytics demonstrate a similar picture.
Following are four different types of big data analytics.
The full content is only visible to SIPMM members
Already a member? Please Login to continue reading.